VideoPhoto

11 February, 2022

How to find out if there are hidden data in Excel cells

You probably know how to hide some values in Excel cells. If not, this is how it can be done:

  • select Home>Format in the Cells group, and then
  • Format Cells...>Number>Custom, and then
  • create the ; or ;; (single or double semicolon) and/or ;;; (triple semicolon) formats

With ; or ;; format you will be able to hide numeric values, and with ;;; format - all textual and numeric values.

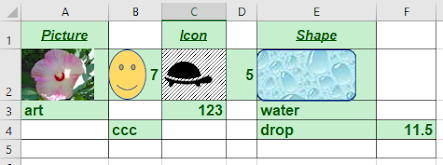
The hiding of values can be enhanced with covering the cells with some graphics (pictures, icons or shapes) as you can see in this simple example:

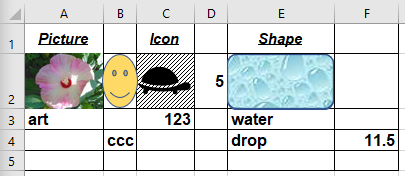
Cells A2,C2 and E2 in this example are custom-formatted with ;;; so each of them may hold a hidden value. Cell A2 holds number 32.58, cell E2 holds value "TEXT" and cell C2 is left blank (no value). Cell B2 holds number 7 and is not custom-formatted. The range I've selected here is A1:F5. The graphics are used in this example just for masking; they are displayed in the top layer of the cells and may be used to hide even not custom-formatted cell value (like in cell B2).

Now, the question is, how you can determine if there are any hidden values within a selected range of cells. Even if you yourself created the spreadsheet some time ago, you may not remember if there are any hidden cell values and would like to check that.

You can use quite straightforward procedure to do that:

  • select the range you want to check
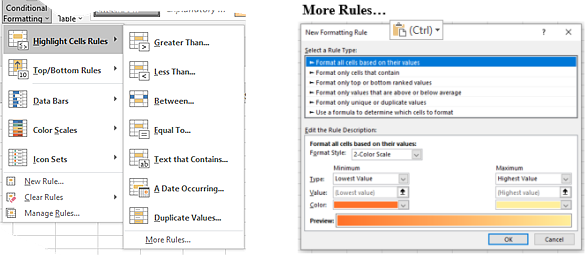
  • in the ribbon select Home>Conditional formatting (in Styles group) >Highlight Cells Rules>Text that Contains... 
  • under Format cells that contain the text: box enter * only and select highlighting option, e.g. Green Fill... , then click OK.

You'll see green-highlighted all cells that contain some values, including the hidden values.

If any of the cells are 'masked' with graphics, you may need to check them individually by temporarily resizing/moving them to see underlying content (if any). This way you'll know that all the green-highlighted cells contain values (doesn't matter if looking like blank or covered with graphics). Cells A2 and E2 have also been highlighted with green. It means there are hidden values entered there. Clicking on green areas show their content in the Formula Bar.

Later on, you can remove the highlighting, if no longer needed. In the meantime, by using some formulas, you can make a number of different checks on the cells in the selected range to confirm existence of cells with hidden values. E.g.:

  • =COUNT(A1:F5)      Counts cells with numeric values in the selected range
  • =COUNTA(A1:F5) or =COUNTIF(A1:F5,"<>") or =SUBTOTAL(103,A1:F5)    Count cells with any value (not empty) in the selected range
  • =SUM(A1:F5)      Returns the sum of numeric values in the selected range
  • =ISTEXT(E2)       Returns TRUE if the cell contains text
  • =COUNTIF(A1:F5,"")  or  =ROWS(A1:F5)*COLUMNS(A1:F5)-SUBTOTAL(103,A1:F5)     Return count of blank cells in the selected range
  • =IF(CELL("format",A2)="H","H","-")     Returns "H" if the selected cell is custom-formatted to hide entered value

The last formula can be used to check for hidden values within the whole range/table of data.


08 February, 2022

Conditional Formatting in Excel: All you need to know

This is about visual identification and/or formatting (differentiation) of our data sets based on our questions (conditions), in order to: 

  • mark/reveal some data of interest, present them
  • take some action (e.g. find errors, correct, sort, delete, evaluate), or
  • find out some trends and patterns, compare.

Here is the Conditional Formatting main menu (on the left) + More Rules dialog:

30 January, 2022

Unique Macro Buttons - Unlimited

If you use macros (VBA code) in Excel you probably use macro buttons as well. There are many ways to create them, but the one I like the most is to utilize just the Excel cells. Yes, nothing else but the cells. Cells are 'pictures'. Obviously, if you'd like to "decorate" them in any way, you could; and at least you'd probably like to mark them somehow in order to recognize that they hold your macro code.

So, you'd start with selecting a cell and entering some (centered) text into it, e.g. 'Run abc...'. Next, to create the button, you'd:

  • copy the cell (using CTRL+C shortcut) and paste it to the same cell (or another - it's your choice) as a Picture (using ALT+H+V+U shortcut)
  • right-click in the cell and select Size & Properties > Properties and select Move & size with cells option (this way the 'picture' will always fit and stay in the same cell)
  • right-click again, select Assign Macro... from the menu and select your macro from the list you'd see in Assign Macro dialog

The cell is now your macro button. Click it to run your assigned macro.

If you'd like to make the button more distinct (visible) you'd add some shape or photo or icon and/or format the cell at your will (prior to pasting it (!) as a Picture). Here is a couple of ideas, if you want to make the button unique:

29 January, 2022

Unique Advanced Filtering

Advanced filtering in Excel is in fact nothing new in recent years, but it is a very useful feature, worth revisiting and reminding its role in data analysis and presentation. In the following example I demonstrate how you can filter the selected data (a list in this case) to show the unique names/IDs, based on just one simple criteria. Not only that; at the same time you can get an additional information - number of times each of the unique names/IDs appears in the list. Here's the setup and the result:

27 January, 2022

Using Excel as Music Player

Do you like to listen in the background to your favourite music while working outside Excel, e.g. in Word, or on your emails? If so, you can use Excel as a music player. To prepare for that you need to create a music library, collection of your music files, located e.g. in MyMusic subdirectory, as in my example.

Having done that, next create in your Excel worksheet a list of Hyperlinks to those files (by using CTRL+K shortcut for each of your music files). The list can be arranged in any order and contain as many hyperlinks as needed. Here is a short example of my list:

24 January, 2022

23 January, 2022

Creating Pixel Art - Iterations

You can use Excel to create some work of art. Over 32000 iterations can be utilized, and this allows to produce lots of pixels in your worksheet and, practically, create unlimited number of 2D 'pictures' and 3D 'sculptures'. All you need is to use the two macros presented at the end of this post (one for drawing and the other for erasing) and some creativity, obviously.

To give you an idea what kind of 'art' I'm talking about, here are just couple of examples:


Before starting your creative work you need to determine name for your picture. Go to Formulas > Define Name in your workbook and enter TRI in the Name: field and =Sheet1!$B$2:$ZZ$601 in Refers to: field.

Next, insert and format two Buttons (Form Controls) similar to what you see here:

Goto to Developer > Insert > Button, add the text (Draw..., Erase...) and assign the two macros to them. You'll use the buttons to create and erase the pictures.

Now you can copy the macros listed below to one of the modules inserted in your workbook (VBAProject). At this point you're ready to start experimenting with the pixel art. There are several parameters (variables) plus functions, formulas, equations, colors etc. that can be changed and manipulated at will.

Here are the macros:

Option Explicit
Sub Sculpture()
'Produces graphics: from random mist to well defined pixel art
'Use provided parameters and translations to define "sculptures"
'Takes several seconds to produce some pixel art

Dim cP(3) As Long
Dim wid As Double
Dim myPts As Single
Dim myRange As Range
Dim cx As Double, cy As Double, rC As Double, iC As Double
Dim xUL As Double, xLL As Double, yUL As Double, yLL As Double
Dim y As Double, x As Double, c As Double, d As Double
Dim intW As Integer, intH As Integer, i As Integer, j As Integer
Dim a As Single, b As Single, sPercent As Single, co As Single
'Color palette; change as needed
cP(0) = 65280       'green
cP(1) = 65535       'yellow
cP(2) = 13382400    'blue
cP(3) = 255         'red
On Error GoTo TheEnd
'Set your canvas range for square cells; here set to B2:ZZ601
Set myRange = Application.InputBox("Select a range in which to create square cells", ,  _"$B$2:$ZZ$601", Type:=8)
On Error Resume Next
If myRange.Cells.Count = 0 Then Exit Sub
GetWidth:       'Set the width of cells (0.08 is my screen pixel size)
wid = Val(InputBox("Input Column Width:", , "0.08"))
If wid < 0.08 Then
    MsgBox "Invalid column width value"
    GoTo GetWidth
End If
Application.ScreenUpdating = False
myRange.EntireColumn.ColumnWidth = wid
myPts = myRange(1).Width        'Set row height
myRange.EntireRow.RowHeight = myPts
xLL = -1.02: xUL = 3.02: yLL = -1.02: yUL = 2.59
intW = myRange.Columns.Count: intH = myRange.Rows.Count
Application.Goto reference:="TRI"   'TRI is the named range (=Sheet1!$B$2:$ZZ$601")
With Selection.Interior
    .Pattern = xlSolid
    .PatternColorIndex = xlAutomatic
    .Color = 0   'Background color; set to black
End With
Range("A1").Select
x = 0: y = 0
cx = 1: cy = 0.5
a = Rnd() * (-10 - 10) + 10: b = Rnd() * (-10 - 10) + 10  'Random real numbers between -10 & 10
For j = 1 To 4      'Iterate by colors
    Select Case j
        Case 1
            co = cP(0)
        Case 2
            co = cP(1)
        Case 3
            co = cP(2)
        Case Else
            co = cP(3)
    End Select
    For i = 1 To 30000  'Number of iterations with each of the colors
        x = cx: y = cy
        c = Sin(a * x): d = Cos(b * y ^ 2)  'Use any other formulas to get desirable results
        cx = d + c * c + 0.6: cy = Sin(2 * a * x) - Sin(c) * d + 0.8    'As above
        iC = Int(intW * (cx - xLL) / (xUL - xLL)): rC = Int(intH * (cy - yLL) / (yUL - yLL))
        myRange.Cells(1 + rC, 1 + iC).Interior.Color = co
        If iC < 2 Then iC = 2: If iC > intW Then iC = intW
        If rC < 2 Then rC = 2: If rC > intH Then rC = intH
    Next i
Next j
Range("Sheet1!B1").Select
myRange.Cells(1, 1).Offset(-1, 0) = "Basic parameters used: a=" & Format(a, "#0.0;-#0.0") & ", b=" & _Format(b, "#0.0;-#0.0")
Application.ScreenUpdating = True
myRange.Cells(1, 1).Offset(-1, -1).Select
TheEnd:
Set myRange = Nothing
If Application.ScreenUpdating = False Then Application.ScreenUpdating = True
End Sub
 

Sub EraseSculpt()
'Clear the graphic and restore cell size
Dim TRI As Name
Application.ScreenUpdating = False
    Application.Goto reference:="TRI"
    Selection.Clear
    With Selection
        .ColumnWidth = 8.43
        .RowHeight = 12.75
    End With
    Range("B1").Select
    Selection.ClearContents
    Range("A2").Select
Application.ScreenUpdating = True
End Sub