VideoPhoto

Showing posts with label macros. Show all posts

25 July, 2023

Shapes Based On Parametric Equations: Epicycloids

Epicycloid is a parametric geometric curve obtained by tracing the path of a chosen point on the circumference of a circle (outside of it). Variety of epicycloid curves find applications in mechanical and construction engineering, e.g. construction of gears, cams, valves, pendulum clocks, robotic actuators, and machine/structures design in general. Contribute also to making designs of arts and animations.

In this context, it is useful to know how to generate epicycloid curves. In this post I'm presenting some of the curves along with the Excel VBA macro for creating this kind of curves. You can try to use it for your own creations. Just copy it to one of the modules in your workbook sheets and experiment with different settings and parameters.

Here are some examples of charts with epicycloid curves, single and double plots. 

22 July, 2023

Excel Comments: Setting Font Format

Default font format in Excel Comments may look like this:

If you want to change some of the font settings (i.e. the Windows font settings), you can either try to adjust font format in "Display settings" of Windows or use VBA code listed below. The second option is better, because it doesn't change font settings in all other Windows applications. Remember that you must make your Comments visible. If necessary, right-click in the cell and click on Show/Hide Comments option.

This is the event driven macro. To use it, you need to:

  • open the Visual Basic for Applications (VBA) editor in Excel (use the shortcut ALT+F11 on your keyboard)
  • click on the View in the top menu and choose Project Explorer option
  • in your VBAProject double-click on Sheet1 and paste the macro code in the window
  • close the VBA editor and return to your Excel worksheet

16 July, 2023

Excel Shapes: Positioning, Formatting and Layout In Worksheets

Excel Shapes are frequently used to enhance visual appeal of worksheets as well as to convey information. It's relatively easy to work with the Shapes. You can insert, resize, rotate, format, and position them within the worksheet, according to your needs.

This post is about special case of positioning and manipulating of Shapes. Namely, I'll show the way of inserting and moving them so that they are located/centred precisely at the crosspoint of 4 surrounding it cells. Furthermore, in this case I'll use a worksheet with squared cells. If you need to know how to make cells square please refer to one of my previous posts (Make cells SQUARE) .

Here are just two examples showing what I'm talking about:

 
These are the formatted Shapes called "Donut" and "Gear with nine teeth". They are placed exactly at the point where the four cells meet together. It's not that easy to do that by hand, so I've created the following Excel macro, to handle this task swiftly:

03 July, 2023

Looking for and Formatting Cells with Different Contents In One Pass

To find and select (and optionally, to format) cells that contain specific information or meet specific conditions we would usually use Go To command. That's simple: on the Home tab click Find & Select > Go To (or use shortcut: CTRL+G). When we click Special in the displayed Go To Special dialog box, we get many options to choose from; can look for Comments, Constants, Formulas, Blanks, Objects, Last cell, Conditional formats, etc.

However, we may need to use a completely different option. What if we'd like to find simultaneously (in one pass) for e.g. two or more different numbers or strings? There is no such option in the dialog box, so we have to find out a different approach.

Here's an example; I'm using the Excel macro listed below to find and fill with different colors all cells (in the specified range) containing four specific values. I need only replace the default values "a,b,3,4" with my own; here I've used "lost,123,mat,cat":

Sub HighlightSpecificCells()
'Applies different fill colors to cells containing different specified values
'This example fills cells containing four different strings/values

Dim rng As Range
Dim cell As Range
Dim inp As String
Dim vaArray() As String
Set rng = Range("A1:Z100")  'Change the range to the desired one
inp = InputBox("Enter values, separated by comma, you want to find in the specified range", _
    "Find and format cells that store specified values", "a,b,3,4")
vaArray = Split(inp, ",")   'Split the string using comma as the delimiter
'Loop through cells of the range
For Each cell In rng
    If cell.Value = vaArray(0) Then cell.Interior.ColorIndex = 4
    If cell.Value = vaArray(1) Then cell.Interior.ColorIndex = 6
    If cell.Value = vaArray(2) Then cell.Interior.ColorIndex = 24
    If cell.Value = vaArray(3) Then cell.Interior.ColorIndex = 44
Next cell
End Sub

This way, in a single pass you find your all specified values and fill the cells with the specified different color for each value.

This is just an example. You can modify the macro to meet your specific number of values, choice of colors, and whatever else you need.


26 May, 2023

Creating Shapes, Graphics, Illustrations - Part 2

Here is yet another way of creating graphics in Excel - using VBA macro, like this one:

Sub DrawDefShape()
'Draws any defined shape representing Bézier curves
Dim x As Integer, y As Integer
Dim pt(1 To 7, 1 To 2) As Single
Dim rng As Range
Set rng = Sheets("Data").Range("A2:B8")
'Fill array of control point coordinates with values
For x = 1 To 7
    For y = 1 To 2
        pt(x, y) = rng.Cells(x, y).Value
    Next y
Next x
Set myDoc = Worksheets("Data")
myDoc.Shapes.AddCurve SafeArrayOfPoints:=pt
Range("A10").Select
'Display the whole 2D array in MsgBox
For i = 1 To UBound(pt)
dPts = dPts & pt(i, 1) & "   " & pt(i, 2) & vbNewLine
Next i
MsgBox dPts
End Sub

Before going into the details of the macro structure and its use, let's look at some examples of curves and shapes you can easily create with it. Here they are:

20 May, 2023

Excel Tips and Solutions for Every User

With over 110 posts published so far in my blog I've decided to summarize them in carefully edited eBook format (Kindle edition). You can have a look at it here .

It covers many less known Excel features and topics, from workbook design principles to quite sophisticated VBA programming tasks and some creative art.

If you are serious about your proficiency in using Excel program, this eBook may be worth to get it and keep it handy.

Here's the book cover:


 348 pages of creative ideas and solutions.


30 April, 2023

Jumping Across Cells with Enter Key

Normally, in Excel, when you press Enter key - depending on your initial selection of editing options - you move in one of the directions (Down, Right, Up, Left), as shown in the snippet, by just one cell. There are no other options available in Excel settings. I'm using the Down option for the purpose of this post.

So, what you can do, if for some reason you definitely need to move automatically and repeatedly from the current cell by more than one cell and in any selected direction?

24 April, 2022

30 January, 2022

Unique Macro Buttons - Unlimited

If you use macros (VBA code) in Excel you probably use macro buttons as well. There are many ways to create them, but the one I like the most is to utilize just the Excel cells. Yes, nothing else but the cells. Cells are 'pictures'. Obviously, if you'd like to "decorate" them in any way, you could; and at least you'd probably like to mark them somehow in order to recognize that they hold your macro code.

So, you'd start with selecting a cell and entering some (centered) text into it, e.g. 'Run abc...'. Next, to create the button, you'd:

  • copy the cell (using CTRL+C shortcut) and paste it to the same cell (or another - it's your choice) as a Picture (using ALT+H+V+U shortcut)
  • right-click in the cell and select Size & Properties > Properties and select Move & size with cells option (this way the 'picture' will always fit and stay in the same cell)
  • right-click again, select Assign Macro... from the menu and select your macro from the list you'd see in Assign Macro dialog

The cell is now your macro button. Click it to run your assigned macro.

If you'd like to make the button more distinct (visible) you'd add some shape or photo or icon and/or format the cell at your will (prior to pasting it (!) as a Picture). Here is a couple of ideas, if you want to make the button unique:

23 January, 2022

Creating Pixel Art - Iterations

You can use Excel to create some work of art. Over 32000 iterations can be utilized, and this allows to produce lots of pixels in your worksheet and, practically, create unlimited number of 2D 'pictures' and 3D 'sculptures'. All you need is to use the two macros presented at the end of this post (one for drawing and the other for erasing) and some creativity, obviously.

To give you an idea what kind of 'art' I'm talking about, here are just couple of examples:


Before starting your creative work you need to determine name for your picture. Go to Formulas > Define Name in your workbook and enter TRI in the Name: field and =Sheet1!$B$2:$ZZ$601 in Refers to: field.

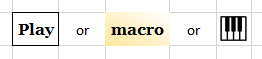
Next, insert and format two Buttons (Form Controls) similar to what you see here:

Goto to Developer > Insert > Button, add the text (Draw..., Erase...) and assign the two macros to them. You'll use the buttons to create and erase the pictures.

Now you can copy the macros listed below to one of the modules inserted in your workbook (VBAProject). At this point you're ready to start experimenting with the pixel art. There are several parameters (variables) plus functions, formulas, equations, colors etc. that can be changed and manipulated at will.

Here are the macros:

Option Explicit
Sub Sculpture()
'Produces graphics: from random mist to well defined pixel art
'Use provided parameters and translations to define "sculptures"
'Takes several seconds to produce some pixel art

Dim cP(3) As Long
Dim wid As Double
Dim myPts As Single
Dim myRange As Range
Dim cx As Double, cy As Double, rC As Double, iC As Double
Dim xUL As Double, xLL As Double, yUL As Double, yLL As Double
Dim y As Double, x As Double, c As Double, d As Double
Dim intW As Integer, intH As Integer, i As Integer, j As Integer
Dim a As Single, b As Single, sPercent As Single, co As Single
'Color palette; change as needed
cP(0) = 65280       'green
cP(1) = 65535       'yellow
cP(2) = 13382400    'blue
cP(3) = 255         'red
On Error GoTo TheEnd
'Set your canvas range for square cells; here set to B2:ZZ601
Set myRange = Application.InputBox("Select a range in which to create square cells", ,  _"$B$2:$ZZ$601", Type:=8)
On Error Resume Next
If myRange.Cells.Count = 0 Then Exit Sub
GetWidth:       'Set the width of cells (0.08 is my screen pixel size)
wid = Val(InputBox("Input Column Width:", , "0.08"))
If wid < 0.08 Then
    MsgBox "Invalid column width value"
    GoTo GetWidth
End If
Application.ScreenUpdating = False
myRange.EntireColumn.ColumnWidth = wid
myPts = myRange(1).Width        'Set row height
myRange.EntireRow.RowHeight = myPts
xLL = -1.02: xUL = 3.02: yLL = -1.02: yUL = 2.59
intW = myRange.Columns.Count: intH = myRange.Rows.Count
Application.Goto reference:="TRI"   'TRI is the named range (=Sheet1!$B$2:$ZZ$601")
With Selection.Interior
    .Pattern = xlSolid
    .PatternColorIndex = xlAutomatic
    .Color = 0   'Background color; set to black
End With
Range("A1").Select
x = 0: y = 0
cx = 1: cy = 0.5
a = Rnd() * (-10 - 10) + 10: b = Rnd() * (-10 - 10) + 10  'Random real numbers between -10 & 10
For j = 1 To 4      'Iterate by colors
    Select Case j
        Case 1
            co = cP(0)
        Case 2
            co = cP(1)
        Case 3
            co = cP(2)
        Case Else
            co = cP(3)
    End Select
    For i = 1 To 30000  'Number of iterations with each of the colors
        x = cx: y = cy
        c = Sin(a * x): d = Cos(b * y ^ 2)  'Use any other formulas to get desirable results
        cx = d + c * c + 0.6: cy = Sin(2 * a * x) - Sin(c) * d + 0.8    'As above
        iC = Int(intW * (cx - xLL) / (xUL - xLL)): rC = Int(intH * (cy - yLL) / (yUL - yLL))
        myRange.Cells(1 + rC, 1 + iC).Interior.Color = co
        If iC < 2 Then iC = 2: If iC > intW Then iC = intW
        If rC < 2 Then rC = 2: If rC > intH Then rC = intH
    Next i
Next j
Range("Sheet1!B1").Select
myRange.Cells(1, 1).Offset(-1, 0) = "Basic parameters used: a=" & Format(a, "#0.0;-#0.0") & ", b=" & _Format(b, "#0.0;-#0.0")
Application.ScreenUpdating = True
myRange.Cells(1, 1).Offset(-1, -1).Select
TheEnd:
Set myRange = Nothing
If Application.ScreenUpdating = False Then Application.ScreenUpdating = True
End Sub
 

Sub EraseSculpt()
'Clear the graphic and restore cell size
Dim TRI As Name
Application.ScreenUpdating = False
    Application.Goto reference:="TRI"
    Selection.Clear
    With Selection
        .ColumnWidth = 8.43
        .RowHeight = 12.75
    End With
    Range("B1").Select
    Selection.ClearContents
    Range("A2").Select
Application.ScreenUpdating = True
End Sub


16 December, 2021

How to create Activity Tracker / Timer

If you'd like to keep in Excel the record of your common daily tasks, in terms of disciplined use of your valuable time, then the solution I'm providing here can be helpful. It makes easy recording of duration of any routine daily activities and provides basis for further analysis of any kind.

This is how it looks like in an exemplary edition:

08 June, 2021

How to create a 'slide show' using a single formula and a chart

If you want to make use of some math formulas for practical applications or just to show off your Excel creativity, you can utilize kind of slide show: = refreshable charts based on your brilliant formula.

Follow these steps:

  • Open a new workbook. Enter any two numbers into your worksheet (Sheet1), e.g. 1 in cell A2 and 2 in B2.
  • Start with creating a simple XY scatter chart based on your entries. This chart is named as "Chart 1".
  • Delete the two numbers you've just entered. You don't need them.
  • Expand the width of column A to e.g. 200, move there the chart and resize it to the size of your choice.
  • In cell D1, type the formula you want to chart, in the format using explicitly normal math signs and functions, e.g. x^2+5*sqrt(x)-3 .
  • Enter the low and high limits (of your choice) for the Left value and the Right value of x axis, then also the Low and High limits for the number of Points you want to be plotted, as shown in the example below (cells D3:E5).
  • In cells F3:F5, enter RANDBETWEEN formulas as shown in the example, cells F3:F5.

26 May, 2021

Outliers in normally distributed datasets

I've recently touched the subject of statistical analysis of data using Excel functions. In this post I dive deeper into Excel statistical tools. It's about outliers in data sets, about numbers that distort the state of reality and can lead to unsound findings and conclusions regarding specific areas of knowledge.

There are no strict statistical rules for indisputable ways of identifying outliers; we are dealing with probabilities. Nonetheless, there are guidelines and tests we can utilize to find outlying values, and they can significantly improve our intuition, formally.

Because of the importance of detecting outliers I've prepared Excel workbook providing practical tools (tests) for identifying such deviating/departing values within any set of numerical data. The workbook includes basic guidelines for using some specific statistical tests; I'm showing here its fragment:

17 May, 2021

Presentations in Excel

If most of your work, you do for presentations, comes from Excel, there is no reason to use the PowerPoint instead of Excel itself for preparing your demonstration.

In fact, all your charts, tables, forms, textual info, background graphics, and even sounds, can be quite easily presented and put in order in Excel worksheets.  All the hassle with extra work of copying and pasting into PowerPoint could not be necessary.

Let's say, you've carried out your data analysis and prepared workbook with 30 perfect  worksheets ('slides') for your quarterly presentation. How would you proceed to get ready for reporting your work? Switching to PowerPoint? Not necessarily.

If you'd decide to stay with Excel, the following steps could probably be more efficient way to go. 

First, put all your presentable worksheets in consecutive order in which they'll be presented.

Add a blank worksheet dedicated to a title page. Excel has all the tools needed to create an attractive design. Such a worksheet could show just the subject of your presentation or might be a bit more elaborated, as e.g. in this figure:


Similarly, you can add another worksheet for displaying "The end" page, if appropriate.

05 May, 2021

Colorful randomized worksheet creations

Using some Excel functions and conditional formatting you can create unusual graphics, backgrounds, images etc. Here are some of my creations.

Labyrinth

I followed these steps to create this example:

  • selected the sheet and set column width to 2
  • entered in cell B2 this formula: =IF(SUM(A1:C1)=INT(RAND()+0.5),1,"")
  • copied the formula to B2:BC30 range
  • used Conditional Formatting to display the icons, namely: selected the range and set formatting rule to show icon when cell value is >=1, and no icon when cell value is <1 and >=0
  • filled the range with green background color

Sierpiński Triangle


This triangle was created as described here:

  • selected the sheet and set column width to 2
  • entered in cell B2 this formula: =IF(SUM(A1:C1)=1,1,"")
  • copied the formula to B2:BR37 range
  • entered "1" in cell AJ3
  • used Conditional Formatting to display the icons, namely: selected the range and set two formatting rules:
  1. Format based on Icon Sets style when cell value is >=1, and
  2. Format only cells containing cell value ="" to selected Color and Pattern

Random Paths

This random pattern has been created, after setting column width to 2, with the following formula:

=IF(SUM(A1:C1)>0,SIN(RAND()*45),COS(RAND()*45))

entered in cell B2 and copied to B2:BC30 range. In Conditional Formatting I used formatting rule with Icon Set, when cell values is>=75 percent,<75 and>=50 percent, and <50 and >=25 percent.

Mosaic

To create a similar mosaic of colors in certain range of quadratic cells, set the column width to 2 and then use the following macro code. You need to copy and paste the code into open VBE space (press ALT+F11 to get there).

Sub RandomColors()
Dim rng As Range
Dim WorkRng As Range
Dim xRed As Byte
Dim xGreen As Byte
Dim xBlue As Byte
On Error Resume Next
xTitleId = "MyColors"
Set WorkRng = Application.Selection
Set WorkRng = Application.InputBox("Range", xTitleId, WorkRng.Address, Type:=8)
For Each rng In WorkRng
xRed = Application.WorksheetFunction.RandBetween(0, 255)
xGreen = Application.WorksheetFunction.RandBetween(0, 255)
xBlue = Application.WorksheetFunction.RandBetween(0, 255)
rng.Pattern = xlSolid
rng.PatternColorIndex = xlAutomatic
rng.Interior.Color = VBA.RGB(xRed, xGreen, xBule)
Next
End Sub


26 April, 2021

Unhide SOME of hidden Rows / Columns

It's quite easy to unhide a whole range of hidden columns or rows in a worksheet. But what if you want to unhide just one specific row or column, or a couple of them only.

Let's say, you've hidden e.g. columns from M to W, and rows from 30 to 40. Now you need to unhide columns S-T and rows 35-38 only. In such a situation probably the best way is a macro way. The following two macros can be very helpful:

Sub UnhideSomeRows()
'Unhide one or more of the hidden rows
Dim sRows As String
Repeat:
    sRows = Application.InputBox("Enter row number(s) to unhide", "Unhide row(s)", "e.g. 12 or 20:25")
    If sRows = "" Then Exit Sub
    On Error Resume Next
    If Err.Number <> 0 Then
        On Error GoTo 0
        Err.Clear
        MsgBox "Please input valid row(s)."
        GoTo Repeat
    End If
    Rows(sRows).EntireRow.Hidden = False
    MsgBox "Row(s) " & sRows & " is/are visible now", vbOKOnly, "Unhide specific Row(s)"
End Sub

Sub UnhideSomeColumns()
'Unhide one or more of the hidden columns
Dim sCols As String
Dim rRng As Range
Repeat:
    sCols = InputBox("Enter column(s) to unhide", "Unhide some of hidden Column(s)", "e.g. H or K:M")
    If sCols = "" Then Exit Sub
    On Error Resume Next
    Set rRng = ActiveSheet.Columns(sCols)
    If Err.Number <> 0 Then
        On Error GoTo 0
        Err.Clear
        MsgBox "Please input valid column(s)"
        GoTo Repeat
    End If
    rRng.EntireColumn.Hidden = False
    MsgBox "Column(s) " & UCase(sCols) & " is/are visible now", vbOKOnly, "Unhide specified Columns"
    Set rRng = Nothing
    On Error GoTo 0
End Sub

I've assigned them to separate Control buttons and gave them names "Unhide Rows" and "Unhide Columns". If you need help to do that, see this link: How to add a button and assign a macro .

I've then combined the two buttons into one, by moving and grouping them together as illustrated in this figure:


To unhide any columns or rows in my worksheet I just click on corresponding line of text on the button.