VideoPhoto

Showing posts with label conditional formatting. Show all posts

11 February, 2022

How to find out if there are hidden data in Excel cells

You probably know how to hide some values in Excel cells. If not, this is how it can be done:

  • select Home>Format in the Cells group, and then
  • Format Cells...>Number>Custom, and then
  • create the ; or ;; (single or double semicolon) and/or ;;; (triple semicolon) formats

With ; or ;; format you will be able to hide numeric values, and with ;;; format - all textual and numeric values.

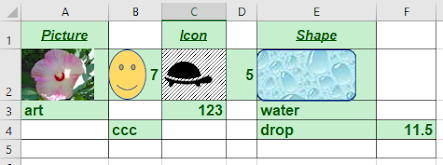
The hiding of values can be enhanced with covering the cells with some graphics (pictures, icons or shapes) as you can see in this simple example:

Cells A2,C2 and E2 in this example are custom-formatted with ;;; so each of them may hold a hidden value. Cell A2 holds number 32.58, cell E2 holds value "TEXT" and cell C2 is left blank (no value). Cell B2 holds number 7 and is not custom-formatted. The range I've selected here is A1:F5. The graphics are used in this example just for masking; they are displayed in the top layer of the cells and may be used to hide even not custom-formatted cell value (like in cell B2).

Now, the question is, how you can determine if there are any hidden values within a selected range of cells. Even if you yourself created the spreadsheet some time ago, you may not remember if there are any hidden cell values and would like to check that.

You can use quite straightforward procedure to do that:

  • select the range you want to check
  • in the ribbon select Home>Conditional formatting (in Styles group) >Highlight Cells Rules>Text that Contains... 
  • under Format cells that contain the text: box enter * only and select highlighting option, e.g. Green Fill... , then click OK.

You'll see green-highlighted all cells that contain some values, including the hidden values.

If any of the cells are 'masked' with graphics, you may need to check them individually by temporarily resizing/moving them to see underlying content (if any). This way you'll know that all the green-highlighted cells contain values (doesn't matter if looking like blank or covered with graphics). Cells A2 and E2 have also been highlighted with green. It means there are hidden values entered there. Clicking on green areas show their content in the Formula Bar.

Later on, you can remove the highlighting, if no longer needed. In the meantime, by using some formulas, you can make a number of different checks on the cells in the selected range to confirm existence of cells with hidden values. E.g.:

  • =COUNT(A1:F5)      Counts cells with numeric values in the selected range
  • =COUNTA(A1:F5) or =COUNTIF(A1:F5,"<>") or =SUBTOTAL(103,A1:F5)    Count cells with any value (not empty) in the selected range
  • =SUM(A1:F5)      Returns the sum of numeric values in the selected range
  • =ISTEXT(E2)       Returns TRUE if the cell contains text
  • =COUNTIF(A1:F5,"")  or  =ROWS(A1:F5)*COLUMNS(A1:F5)-SUBTOTAL(103,A1:F5)     Return count of blank cells in the selected range
  • =IF(CELL("format",A2)="H","H","-")     Returns "H" if the selected cell is custom-formatted to hide entered value

The last formula can be used to check for hidden values within the whole range/table of data.


08 February, 2022

Conditional Formatting in Excel: All you need to know

This is about visual identification and/or formatting (differentiation) of our data sets based on our questions (conditions), in order to: 

  • mark/reveal some data of interest, present them
  • take some action (e.g. find errors, correct, sort, delete, evaluate), or
  • find out some trends and patterns, compare.

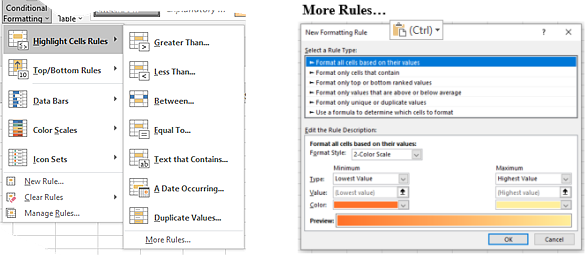
Here is the Conditional Formatting main menu (on the left) + More Rules dialog:

14 October, 2021

How to Check if the Contents of Two Ranges/Worksheets is Different

You are not sure if some ranges of data in your worksheet, or in two different worksheets, contain the same data. How to  figure it out? And if they are different, is the difference significant?

Use ARRAY formula to check it out. You can count the differing cells using e.g. this kind of array formula in Sheet1 to compare with cell contents in Sheet2:

=SUM(IF(B2:G100=Sheet2!B2:G100,0,1))

Remember that to enter it you need to simultaneously hold down the CTRL and the SHIFT keys as you press ENTER. The formula will show up in the formula bar, surrounded by curly brackets.

Also, make sure that the size of compared ranges is the same. Location, however, can be different, like e.g. A2:F20 in one worksheet and C5:H23 in another.

27 August, 2021

STOCK PORTFOLIOS Tracking with Yahoo Finance in Excel - Part 2

In Part 1 I've created exemplary Excel Table for your Portfolio of stocks and provided steps you need to follow for updating the table as you'll need from time to time.

Now add a new worksheet in your workbook. Let's call it "Trades".

In this worksheet, based on the raw data in your created Portfolio table you can create Excel Tables for keeping track of your stock trading, buying and selling. 

Let's say, you just started with couple of records in your Yahoo Finance portfolio and created this Excel Table:

Now you'll reference this table and create two tables for keeping track of your trades. Here is an example of such tables, you can follow if you like:

05 May, 2021

Colorful randomized worksheet creations

Using some Excel functions and conditional formatting you can create unusual graphics, backgrounds, images etc. Here are some of my creations.

Labyrinth

I followed these steps to create this example:

  • selected the sheet and set column width to 2
  • entered in cell B2 this formula: =IF(SUM(A1:C1)=INT(RAND()+0.5),1,"")
  • copied the formula to B2:BC30 range
  • used Conditional Formatting to display the icons, namely: selected the range and set formatting rule to show icon when cell value is >=1, and no icon when cell value is <1 and >=0
  • filled the range with green background color

Sierpiński Triangle


This triangle was created as described here:

  • selected the sheet and set column width to 2
  • entered in cell B2 this formula: =IF(SUM(A1:C1)=1,1,"")
  • copied the formula to B2:BR37 range
  • entered "1" in cell AJ3
  • used Conditional Formatting to display the icons, namely: selected the range and set two formatting rules:
  1. Format based on Icon Sets style when cell value is >=1, and
  2. Format only cells containing cell value ="" to selected Color and Pattern

Random Paths

This random pattern has been created, after setting column width to 2, with the following formula:

=IF(SUM(A1:C1)>0,SIN(RAND()*45),COS(RAND()*45))

entered in cell B2 and copied to B2:BC30 range. In Conditional Formatting I used formatting rule with Icon Set, when cell values is>=75 percent,<75 and>=50 percent, and <50 and >=25 percent.

Mosaic

To create a similar mosaic of colors in certain range of quadratic cells, set the column width to 2 and then use the following macro code. You need to copy and paste the code into open VBE space (press ALT+F11 to get there).

Sub RandomColors()
Dim rng As Range
Dim WorkRng As Range
Dim xRed As Byte
Dim xGreen As Byte
Dim xBlue As Byte
On Error Resume Next
xTitleId = "MyColors"
Set WorkRng = Application.Selection
Set WorkRng = Application.InputBox("Range", xTitleId, WorkRng.Address, Type:=8)
For Each rng In WorkRng
xRed = Application.WorksheetFunction.RandBetween(0, 255)
xGreen = Application.WorksheetFunction.RandBetween(0, 255)
xBlue = Application.WorksheetFunction.RandBetween(0, 255)
rng.Pattern = xlSolid
rng.PatternColorIndex = xlAutomatic
rng.Interior.Color = VBA.RGB(xRed, xGreen, xBule)
Next
End Sub


24 April, 2021

Conditional formatting, about Time

Let's assume, we have in a worksheet a range of Start and Stop times formatted as "hh:mm:ss", and we want to format somehow the cells, so that the times falling outside some time frame, e.g. outside 6:00 AM and 3:00 PM, are clearly highlighted.

To do that we need to get Values  of that two Times, using formulas like these:

=VALUE("06:00:00") resulting in 0.25, and =VALUE("15:00:00") resulting in 0.625 .

Knowing these values, we now use Conditional Formatting feature of Excel to format the outlying Times:
  • First, select your range of cells with times entered.
  • In the ribbon, select Conditional Formatting>Highlight Cells Rules. More Rules...
  • In displayed window select options and enter limiting numbers as shown in the figure below:

  • Then select formatting options you want to, e.g. Bold font or/and blue color, outline border, cell background color.

Example of formatting result is shown here (just random times entered) :


 Happy conditioning! 😁